- Регистрация
- 29.01.2015
- Сообщения
- 214
- Благодарностей
- 64
- Баллы
- 28
After one of my templates failed in Zennoposter and returned the 'active tab of instance not found...' I noticed in Windows Task Manager that Zennoposter itself started to consume about 30% of the CPU resources on the machine.
I mention that I opened Windows Task Manager after putting the template to work in Zenno. It worked fine for about an hour. Zennoposter itself was consuming very low amount of CPU resources (between 1 and 3%).
Then, after an hour the 'active tab of instance not found...' errors appeared. I was not watching zenno and Windows Task Manager in that moment but checked it 2 minutes later, after this error.
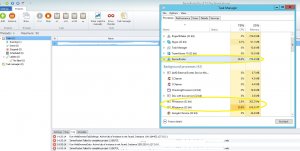
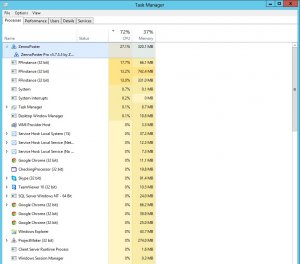
Noticed that Zennoposter started to increase its CPU consumption. Instead of staying at 1-3% as it did during the last hour, now, after bumping into this error, it eats about 30% of the CPU resources. I mention that Zennoposter itself is behaving like this. FFInstances are behaving normally and don't eat that much from the CPU resources.
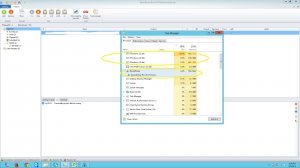
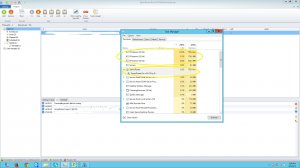
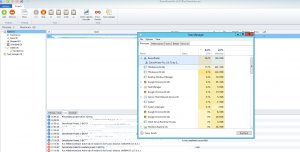
I also attached a screen-shot from Task Manager and Zenno. You can clearly see that FFInstances are needing less resources that Zenno.
I don't know if this is normal and I don't know if the error makes Zenno itself to consume a lot of the CPU resources...or the high consumption of CPU leads to this error. Anyway, it is very strange for me the fact that initially Zennoposter itself needs 1-3% of the CPU and, then, after the active tab of instance error appears, it starts to consume 30% of CPU.
My best guess is that the 'Active tab of instance not found error...' has something to do with strange behavior of Zenno (discussed here about my nightmares with this error: http://zennolab.com/discussion/threads/restart-instance-leads-to-even-more-errors-help.20898/).
At some certain point the total CPU load could go to 100% and, of course, the a/m error would appear.
The machine specs: i5-2500 Sandy Bridge 3.3 Ghz with 12 Gb of RAM memory, SSD etc. The error was received on Zenno 5.7.5.3. Running the template in just 6 threads, Java enabled, flash disabled. I am using this version because it seems to be more stable than the last 5.8 versions (less 'active tab of instance...' errors in 5.7.5.3)
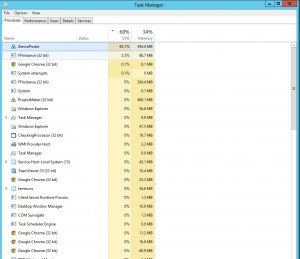
Edit: I also added a screen-shot from the task manager, but this time the processes are ordered depending how much CPU they are consuming. Again, Zennoposter itself is consuming the most CPU resources, followed by FFinstance. When I start with a particular template, FFInstance is highest consumer of CPU resources (and that seems to be the normal situation)
Вложения
-
207,4 КБ Просмотры: 835
-
139,2 КБ Просмотры: 794
Последнее редактирование:
